
There is a temptation, when looking at TLTW, to read the chart in isolation and conclude the fund is broken. The price has fallen from $39.34 at inception to $22.25 today. That is a 43% decline, against a backdrop of 20-year Treasury yields that finished the period higher by a relatively modest 149 basis points. The casual reading: the strategy doesn't work.
The careful reading is more interesting. TLTW launched in August 2022 — directly into the worst long-duration bond drawdown in modern memory. Yields on the 20-year went from 3.38% to over 5% within fourteen months. Any long-duration product would have been crushed in that window. The strategy's actual operating assumption — that yields will move within a range, not in a sustained directional spike — wasn't tested fairly until late 2023. From that point forward, the picture changes substantially.
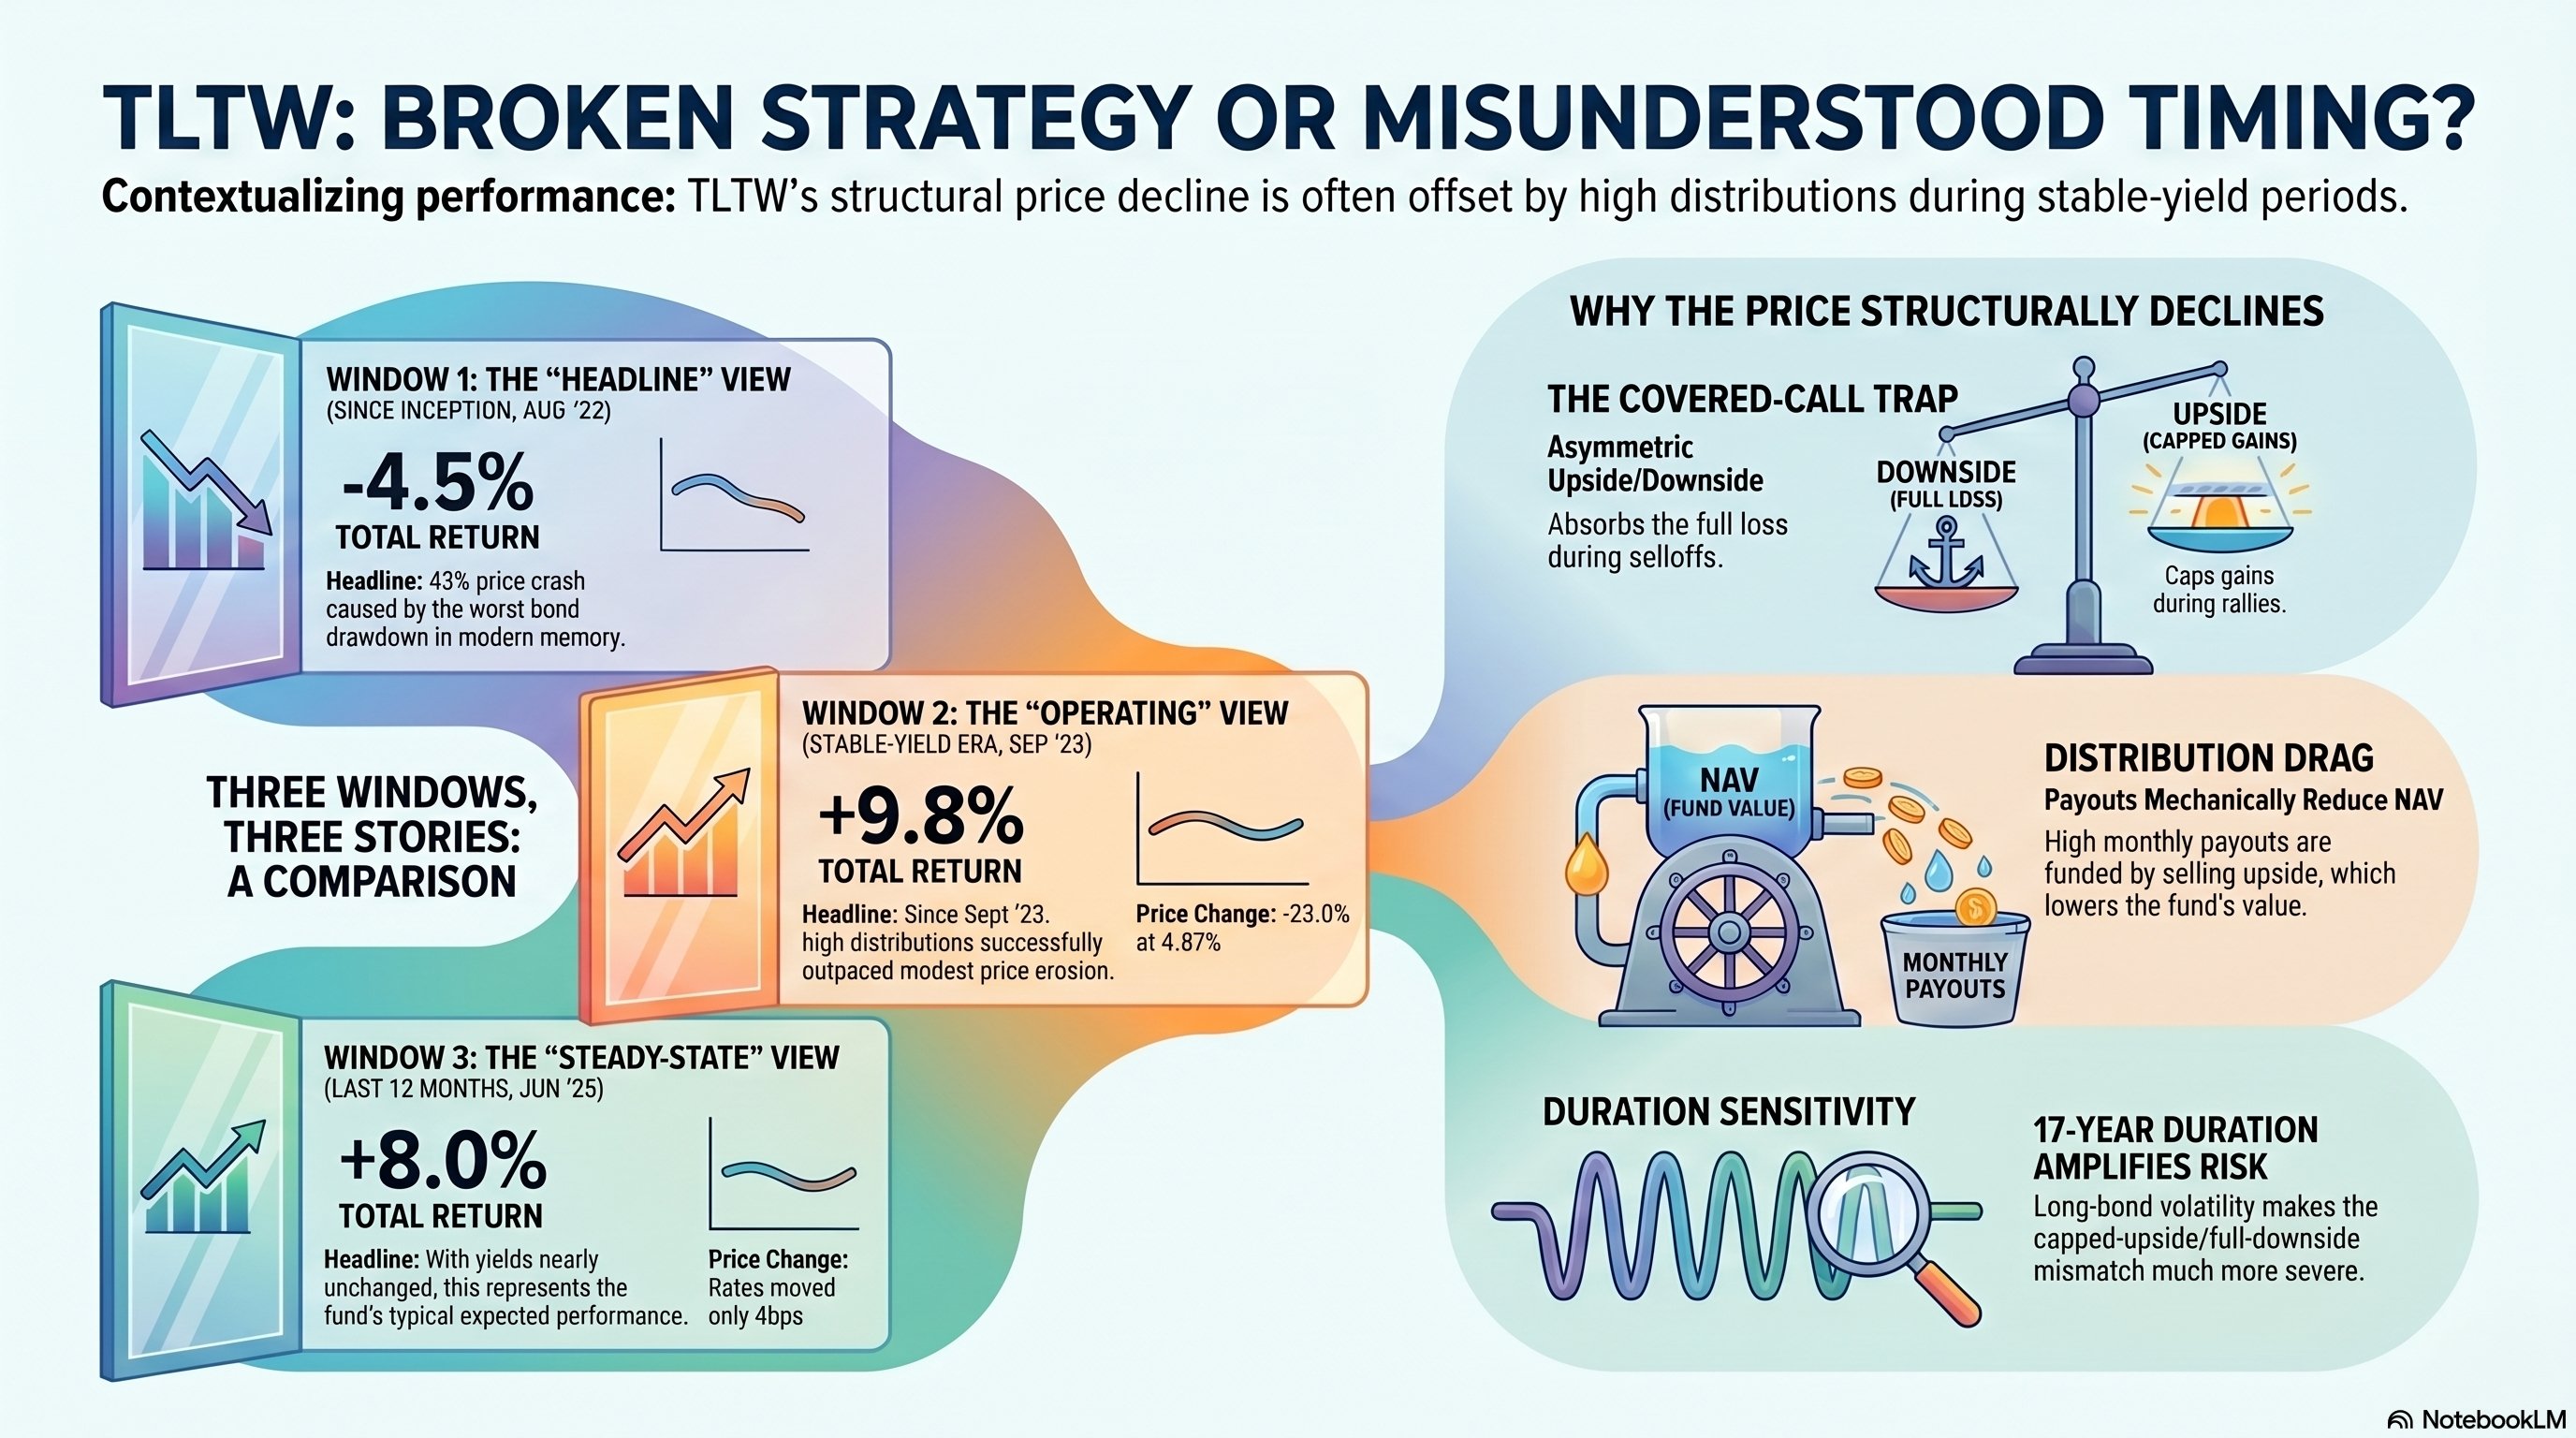
Three windows, three different stories
The same fund, the same monthly data, the same dividend stream. The total-return outcome depends almost entirely on when you choose to start the clock.
The since-inception number is correct. The since-inception number is also misleading. Both things are true.
The since-inception view
Start with the full picture. The fund launched in August 2022 at $39.34. By May 2026 the price had fallen to $22.25. Cumulative distributions over those 46 months totaled $15.33. Adding the distributions back gives an effective ending value of $37.58, or roughly -4.5% below the starting price.
Figure 01
The since-inception view bakes in the 2022 rate spike. Yields rose 149bps over the period; TLTW's price fell 43%. Cumulative dividends clawed most — but not all — of that back. Total return: -4.5%.
The headline number is the price decline. The honest number is the total return — which, even across the worst-case launch window, is only modestly negative. The distributions absorbed almost all of the duration loss.
The stable-yield window
Now shift the start date forward by thirteen months, to September 2023. By that point, the 20-year yield had already moved from 3.4% to 4.87% — the duration damage was done. The next 33 months are roughly the regime TLTW was actually engineered to operate in: yields oscillating within a band, not spiking.
Figure 02
Starting and ending yields are identical at 4.87%. Across 33 months in this near-flat-rate regime, an investor entering at the start booked a +9.8% total return. The covered-call strategy works when its operating assumption — range-bound yields — actually holds.
The price still grinds lower — that is the structural cost of running a covered-call overlay. But the distributions are now meaningfully outpacing the price decay. An investor who entered TLTW in September 2023 and held to today booked a +9.8% total return while collecting consistent monthly cash flow. This is the strategy doing what it was built to do.
The most recent twelve months
Tighten the lens to the last full year. Yields moved by just 4 basis points net over the entire window. The price declined 4.0%. Distributions added $2.79. Total return was +8.0%.
Figure 03
Yields essentially unchanged (4.83% → 4.87%). Price decline of just 4%, distributions of $2.79, total return +8.0%. The most recent twelve months show the structure performing close to its design intent.
This is roughly what a "normal year" looks like for TLTW — small NAV bleed offset by larger distributions, in a yield environment that is doing essentially nothing dramatic. If you want to set expectations for what an investor entering TLTW today might experience, this is the cleanest reference window.
Four mechanics behind the price decline
The covered-call trap is structurally asymmetric.
TLTW sells monthly call options on TLT and distributes the premium as income — often 15 to 20 percent annualized yield. When TLT rallies, TLTW's upside is capped at the call strike; the gains go to the option buyer. When TLT falls, TLTW absorbs the full downside with only a small premium cushion. Over enough months, the asymmetry compounds.
Distributions mechanically reduce NAV.
The high monthly payouts are largely option premium and return of capital — not organic income growth. Each distribution reduces the fund's net asset value by the amount paid. Unlike a stock that can grow earnings to offset its dividend, TLTW has no internal growth engine. The cash going out is funded by selling away upside.
Volatility drag in a range-bound market.
Even "stable" yields oscillate. Each oscillation cycle costs the fund money: rallies are capped, selloffs are fully absorbed. Across dozens of cycles, the cumulative drag compounds. This is the classic vol-selling problem in any environment that is choppy rather than trending — and it explains why even the stable-yield window shows modest price erosion.
Duration sensitivity amplifies everything.
TLT holds 20+ year bonds with a duration of roughly 17 years. A 50bp yield increase can cause an ~8% drop in TLT — which TLTW absorbs fully. A 50bp decrease may only give TLTW a 2 to 3 percent gain because the calls cap participation. Duration amplifies the asymmetry, which is why the 2022 rate spike was so damaging.
What one oscillation cycle costs
The simplest way to see the structural drag is to imagine a single round trip. TLT rallies, then falls back. Yield ends where it started. Here is what happens to TLTW across the two legs:
| TLT Movement | TLTW Result | Net Impact |
|---|---|---|
| TLT rallies +5% | TLTW gains ~1–2% (capped by calls) | Missed ~3–4% upside |
| TLT drops –5% | TLTW loses ~4–5% (full downside, small cushion) | Full loss absorbed |
| Net after one cycle | TLTW is down ~2–3% | Compounds over time |
Run this cycle a dozen times in 3.5 years. The yield ends roughly where it started. TLTW's price ends materially lower. The distributions partially repair the damage; the calls explain why the damage exists in the first place.
Selected monthly data — since inception
A sample of the underlying time series. The full dataset covers all 46 monthly observations from August 2022 through May 2026.
| Month | TLTW Price | 20Y Yield | Cum. Dividends | Price + Cum. Div. |
|---|---|---|---|---|
| Aug '22 | $39.34 | 3.38% | $0.00 | $39.34 |
| Feb '23 | $33.16 | 4.13% | $3.29 | $36.45 |
| Aug '23 | $31.04 | 4.54% | $5.86 | $36.90 |
| Feb '24 | $26.58 | 4.51% | $8.07 | $34.65 |
| Aug '24 | $26.66 | 4.18% | $9.60 | $36.26 |
| Feb '25 | $24.20 | 4.52% | $11.65 | $35.85 |
| Aug '25 | $22.81 | 4.50% | $13.51 | $36.32 |
| Feb '26 | $23.52 | 4.50% | $14.80 | $38.32 |
| May '26 | $22.25 | 4.87% | $15.33 | $37.58 |
Who this product is for, and who it isn't
Income-focused investors with a view that yields are range-bound.
Particularly useful in tax-advantaged accounts where the high distribution rate is not eroded by taxes, or as a cash-flow supplement in retirement portfolios where current income is the priority. Investors who understand they are buying a high-coupon, structurally-decaying instrument — and who hold the view that yields will trade in a range rather than spike. The Sep 2023 forward window shows what this looks like when the operating thesis holds.
Investors seeking duration exposure or total returns comparable to TLT.
The covered-call overlay will consistently underperform TLT in strong rallies — gains are capped. It will only marginally outperform in flat-to-slightly-down markets. Anyone who wants long Treasury duration without the structural decay should hold TLT directly. The "covered call" framing implies risk reduction; what TLTW actually delivers is a return-profile transformation, not a hedge.
The bottom line
TLTW is not broken. It is working exactly as designed — trading future price appreciation for current income, month after month. The headline "43% decline" reflects a specific launch window that included the worst long-duration bond drawdown in a generation. Strip that out and the strategy is delivering positive total returns in the rate environment it was actually built for.
Anyone evaluating TLTW for purchase today is not buying it from August 2022. They are buying it from a starting yield that already absorbs the rate spike. The relevant frame is the post-September-2023 window — where total return has been +9.8% across 33 months and the distribution income has been the dominant component of return. That is what the steady-state experience looks like. Whether it suits your portfolio depends on whether you want bond exposure for income or for duration.
- TLTW monthly prices and distributions: Yahoo Finance / stockanalysis.com, Aug 2022 through May 2026
- 20-year Treasury constant maturity yield: Federal Reserve H.15 Selected Interest Rates release
- Strategy mechanics: iShares TLTW fund prospectus and methodology documentation
- Total return computations: derived directly from monthly price and distribution series; cumulative dividends measured from the start of each timeframe window
This report is for informational purposes only and does not constitute investment advice. Past performance is not indicative of future results. Investors should consult their own advisors before making decisions about derivatives-based or income-strategy ETFs.